AI test automation for hardware: how agents generate, run, and interpret bench tests
By Alex Hernandez · · 12 min read
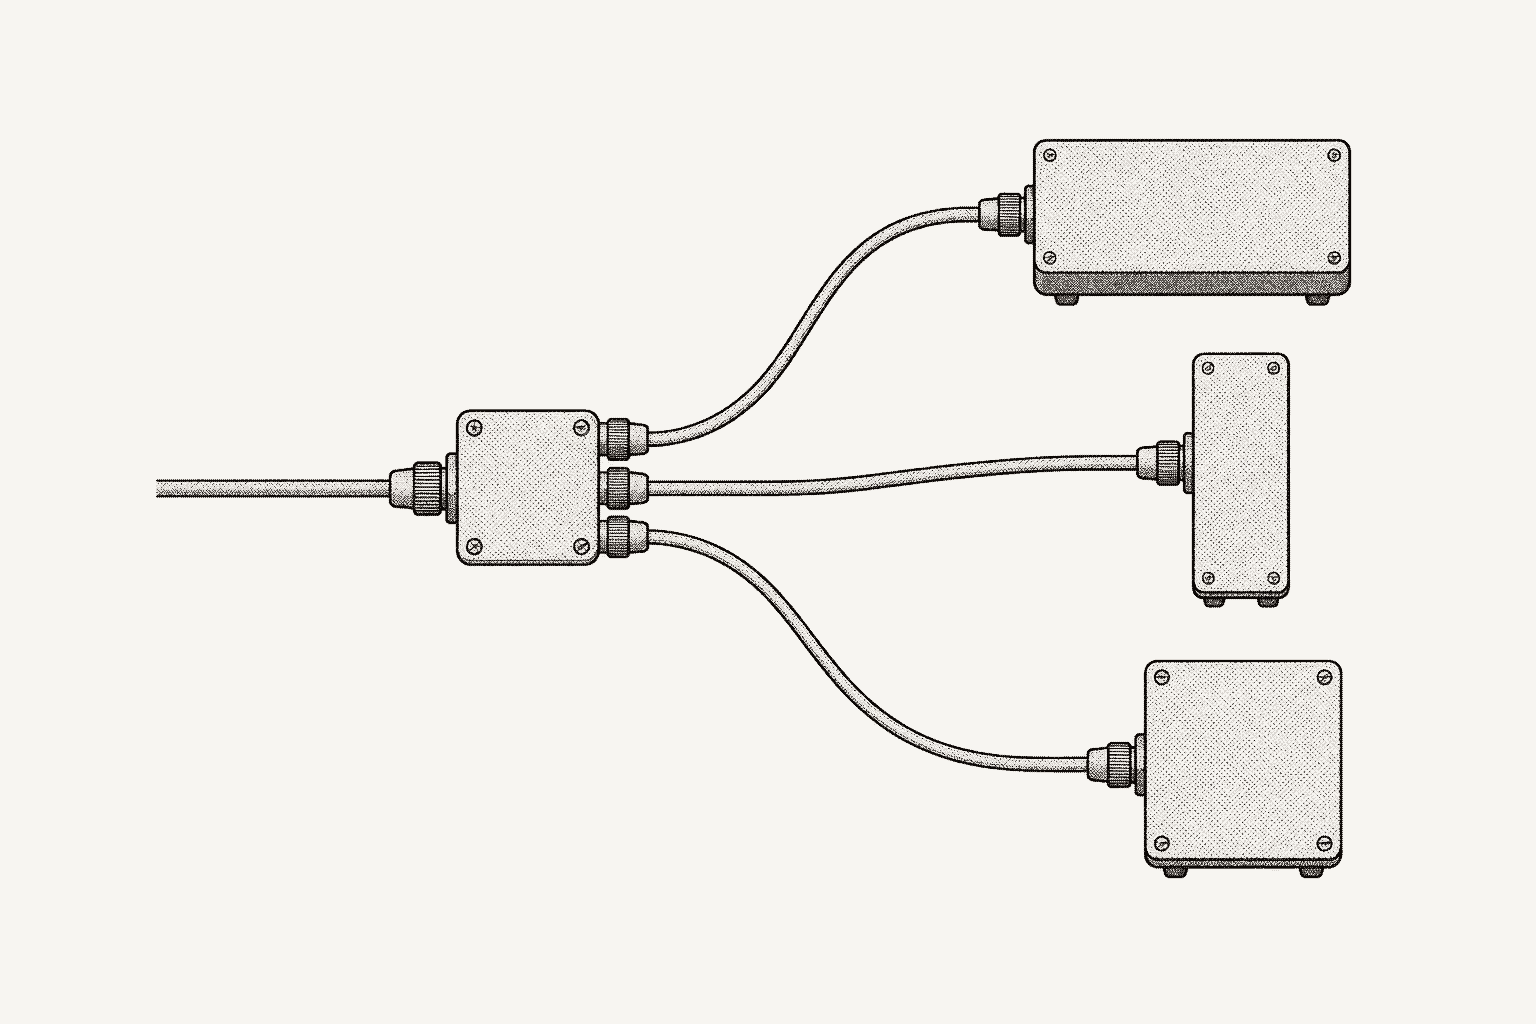
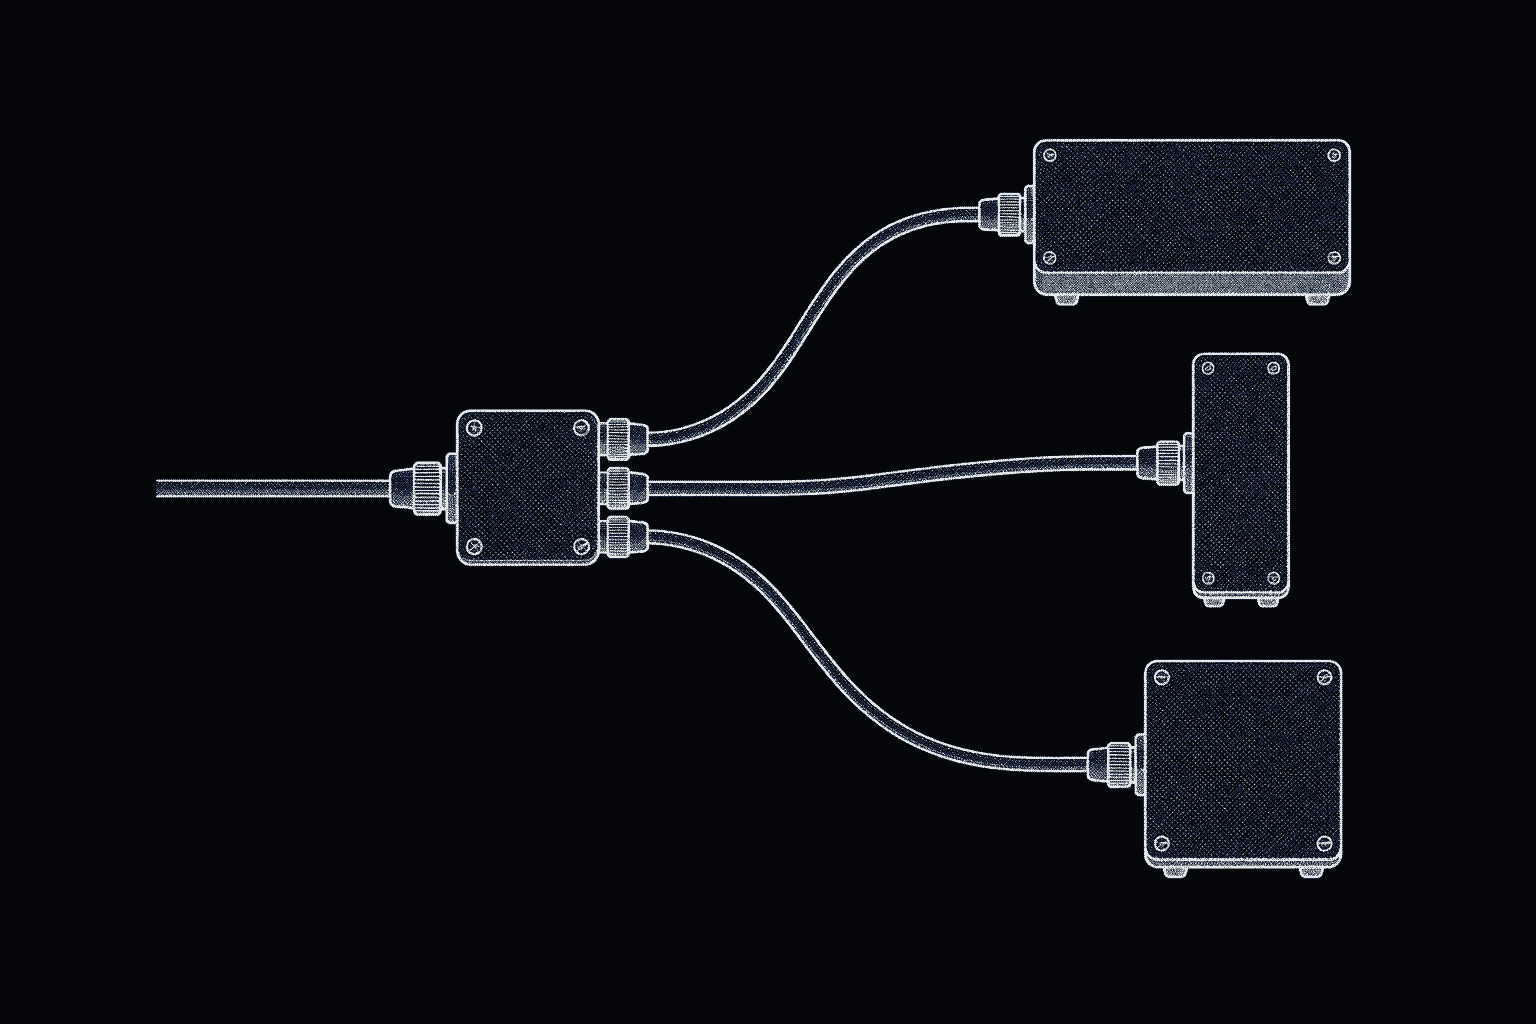
AI test automation for hardware works like this: the engineer defines the objective, the hardware, and the acceptance criteria. Agents generate the test sequence and any missing instrument drivers, run the sequence on a real bench, interpret the results, and draft the report. Engineers set the execution limits and approve each consequential step.
Most of the engineering lives in the limits: what an agent may send to an instrument, what gets recorded when it does, and who has to say yes first.
Galois is agent-driven test engineering for hardware teams: agents generate tests and instrument drivers, run them on real benches through the open-source galois-edge daemon, and turn the results into reports and a shared engineering record. The examples use Galois because we built it; the questions apply to any tool in this category.
The loop: generate, execute, interpret, deliver
Four stages, one record:
- Generate. Agents write the test sequence, plus instrument profiles (drivers) for anything the bench cannot yet talk to.
- Execute. Agents run it on physical instruments through a daemon on the bench.
- Interpret. Agents read per-step results against limits and earlier runs.
- Deliver. Agents draft the report and assemble evidence from the same data.
Everything lands on one engineering record: the sequence with its version history and approval, the instrument, the commands sent and responses received, and the measurements against their limits. That record makes the loop more than a chat transcript; the next run starts from what the team already learned.
Two jobs stay with engineers. They govern execution limits (which commands, over what ranges, on which bench) and they make the consequential approvals (whether a sequence runs, whether a result stands). The product overview shows the same stages in the interface.
Why hardware is not software test automation
Software test automation assumes tests are cheap, repeatable, and isolated, and that a failed run leaves nothing behind. A bench breaks each assumption.
State persists. An output left enabled, a relay left latched, a scope left in single-trigger mode: the next step inherits whatever the last one did. An agent that retries a failed step the way it would retry a flaky HTTP call can re-apply power to a board that just failed short.
Mistakes can be physical. Overdrive a source-measure unit or ramp a magnet too fast and the cost is a damaged part or instrument, not a red build badge. Some actions cannot be undone.
Physics sets the clock. Thermal soak, settling, warm-up, and dwell take as long as they take. An agent can write a sequence quickly; it cannot make a chamber reach temperature sooner.
The agent cannot see the bench. Probe placement, cabling, fixture contact, and which unit is in the socket are invisible to software unless something measures them.
So the useful question for any AI test automation tool is not how fast it writes a test. It is what is guaranteed before a command reaches an instrument, and what is kept after.
Generate: from an English objective to a reviewable sequence
The engineer states the objective, hardware, and acceptance criteria. For example: with the supply at 12 V, confirm the board's 3.3 V rail reads between 3.2 V and 3.4 V.
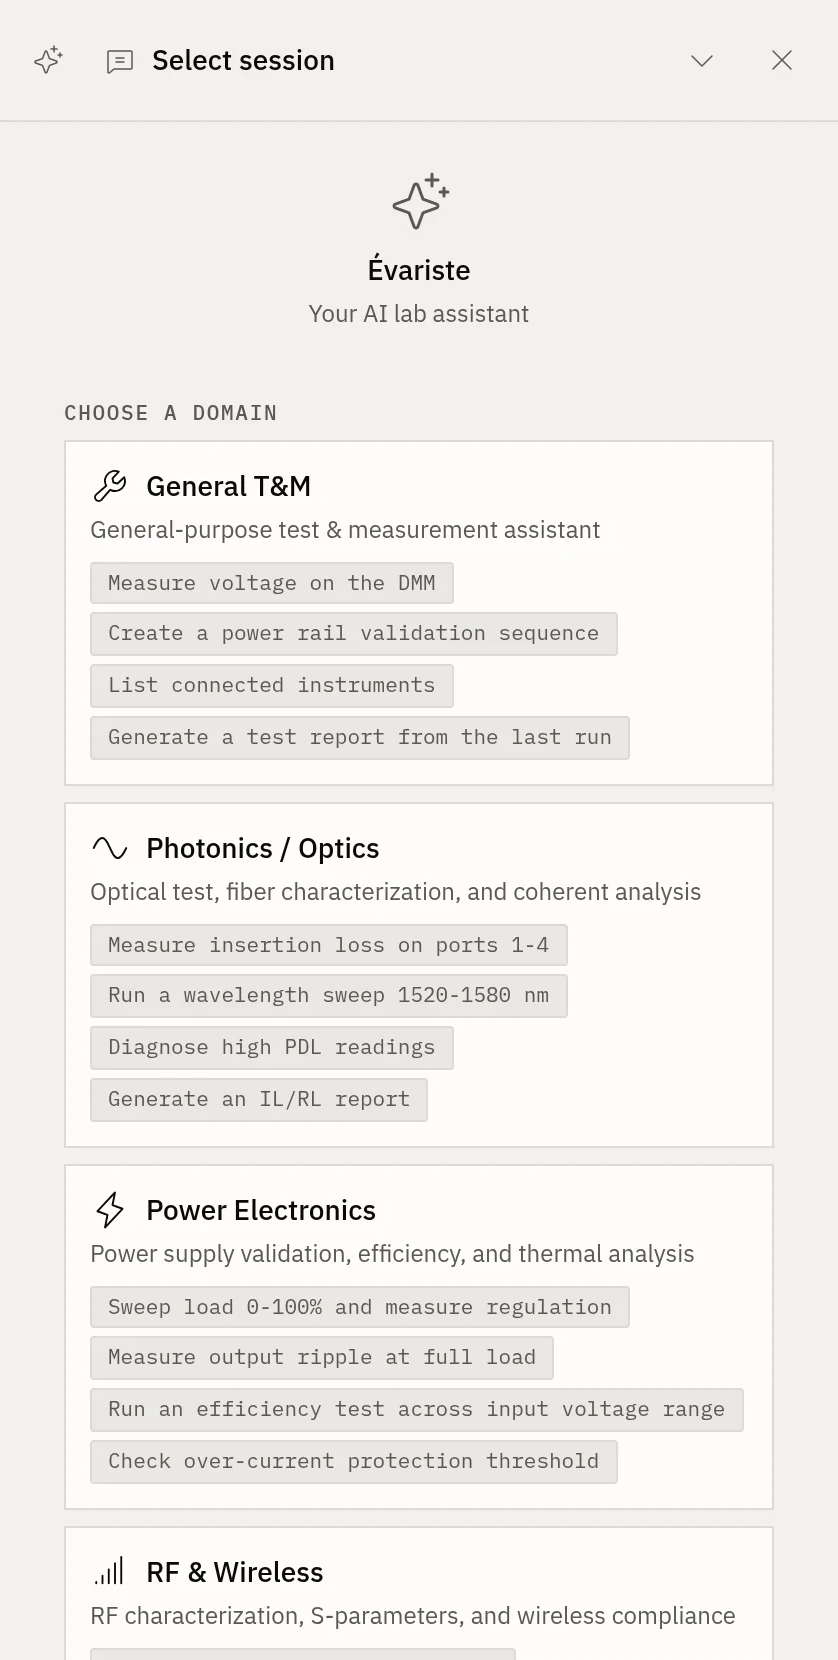
The agent writes a sequence. In Galois that is Évariste, the agent in the Galois platform, and the sequence is versioned YAML: named steps, each with a type (action, wait, numeric limit, loop, condition, and others), a target instrument, a named command from its profile, and explicit limits. A shortened illustration:
name: "3.3 V rail check"
steps:
  - name: "Set input to 12 V"
    type: action
    config:
      instrument_id: "psu"
      command_name: "source_voltage"
      parameters: { value: "12.0" }

  - name: "Enable output"
    type: action
    config:
      instrument_id: "psu"
      command_name: "output_on"

  - name: "Settle"
    type: wait
    config: { duration_ms: 500 }

  - name: "Measure 3.3 V rail"
    type: numeric_limit
    config:
      instrument_id: "dmm"
      command_name: "measure_voltage_dc"
      low_limit: 3.2
      high_limit: 3.4
      unit: "V"
      comparison: "GELE"

  - name: "Disable output"
    type: action
    config:
      instrument_id: "psu"
      command_name: "output_off"
Three properties matter more for agents than for people.
Steps call named commands, not raw SCPI. Évariste picks source_voltage from the supply's profile; the profile owns the SCPI string and parameter types. Its choices stay inside a vocabulary someone already reviewed.
It is text. The sequence diffs like code, so a reviewer sees exactly what changed between Évariste's draft and the version that runs. Graphical VIs cannot offer that, which is much of the case in Galois vs LabVIEW and TestStand alternatives.
It is gated. A generated sequence is a draft, and the platform refuses to run a draft until an engineer approves it. Edit it after approval and it needs a new approval. Production versions can be locked. How to review an AI-generated test plan covers what to check before approving.
Drivers come from the same process
The instrument library lists 573 profiles from 135 manufacturers, and a profile is also YAML: an identity pattern matched against *IDN?, the supported interfaces, and commands with typed parameters, units, ranges, and safety flags (schema reference).
For an instrument outside the library, an engineer uploads its programming manual to Évariste, which drafts the profile (PDF-to-driver). The daemon validates profiles on load and rejects entries that fail its schema checks, but validation catches malformed YAML, not a wrong SCPI mnemonic. Review a drafted profile like any generated code before it drives hardware; adding a SCPI instrument profile shows how to write or check one by hand.
Why declarative profiles beat generated driver classes is argued in Declarative instrument drivers. In short: a profile is a constrained, reviewable artifact, and its constraints are what the execution layer enforces.
Execute: the daemon, MCP, and the guardrails
Execution happens on the bench. The galois-edge daemon (Apache-2.0) runs on the machine wired to the instruments: Linux, Windows, or a Raspberry Pi. It discovers instruments over GPIB, USB, LAN, and serial, matches each to a profile, and also drives CAN, Modbus, and vendor-SDK devices. A run can start from the cloud platform while the daemon executes it locally.
Agents reach the daemon through MCP, the Model Context Protocol, an open standard Anthropic released in November 2024 for connecting AI applications to external tools. An MCP server lists tools, each with a name, a description, and a JSON Schema for its inputs; the client's model decides which to call. galois-edge serves MCP over streamable HTTP at :8767/mcp, so any MCP client can connect, from Claude Desktop to LangGraph (agents overview).
What an agent sees there:
- Static tools, always present: discovery (
list_instruments,get_capabilities), execution (execute_command,execute_sequence,send_scpi), and long-running sweeps and streams. - Per-instrument tools, generated from each matched profile and named
<profile>__<command>, such askeithley_2400__source_voltage. Each tool's input schema comes from the profile: types, units, enums, minimums, and maximums. - Hot-plug. Plug in an oscilloscope and the daemon matches its
*IDN?to a profile, registers its commands as tools, and sends MCPnotifications/tools/list_changedso the client refreshes. Unplug it and the tools disappear. The agent never reads the scope's manual; it reads the tool list.
The guardrails
Safety does not come from asking the model to be careful. It comes from limits the model cannot change: typed calls are checked against the profile's ranges before any command reaches the instrument, ramps marked requires_sweep run on the daemon rather than as a loop of tool calls, and a sequence cannot run until an engineer approves it. Commands flagged is_dangerous are also published with the MCP destructiveHint annotation so a client can ask a human first; the MCP tools specification says clients must treat annotations as untrusted unless the server is trusted, so that flag prompts rather than enforces. Can an LLM safely drive lab instruments? covers the failure modes and the layered controls, including what each layer leaves uncovered.
Access depends on the path. On the direct path, network access to the daemon's MCP port is the boundary, and the port is exposed on the tailnet address and 0.0.0.0, so keep it off untrusted networks. On the relay path, every call carries a signed per-call token that the daemon checks against tool permissions, and unless the token allows dangerous commands, the daemon refuses any flagged command. The raw send_scpi tool skips profile validation, so leave it out of any permission set an agent runs under. MCP for lab instruments covers both paths, from first connection to a reviewed sequence, and the security page covers the wider model.
So engineers set limits in three places: profiles, permissions, and approvals. An agent operates inside all three.
Interpret: every step leaves a trace
An agent's account of what it did is not evidence. The run record is. Each step records the measured value, the limits it was judged against, the raw command sent and the raw response received, the instrument, the operator, the DUT serial, and a timestamp.
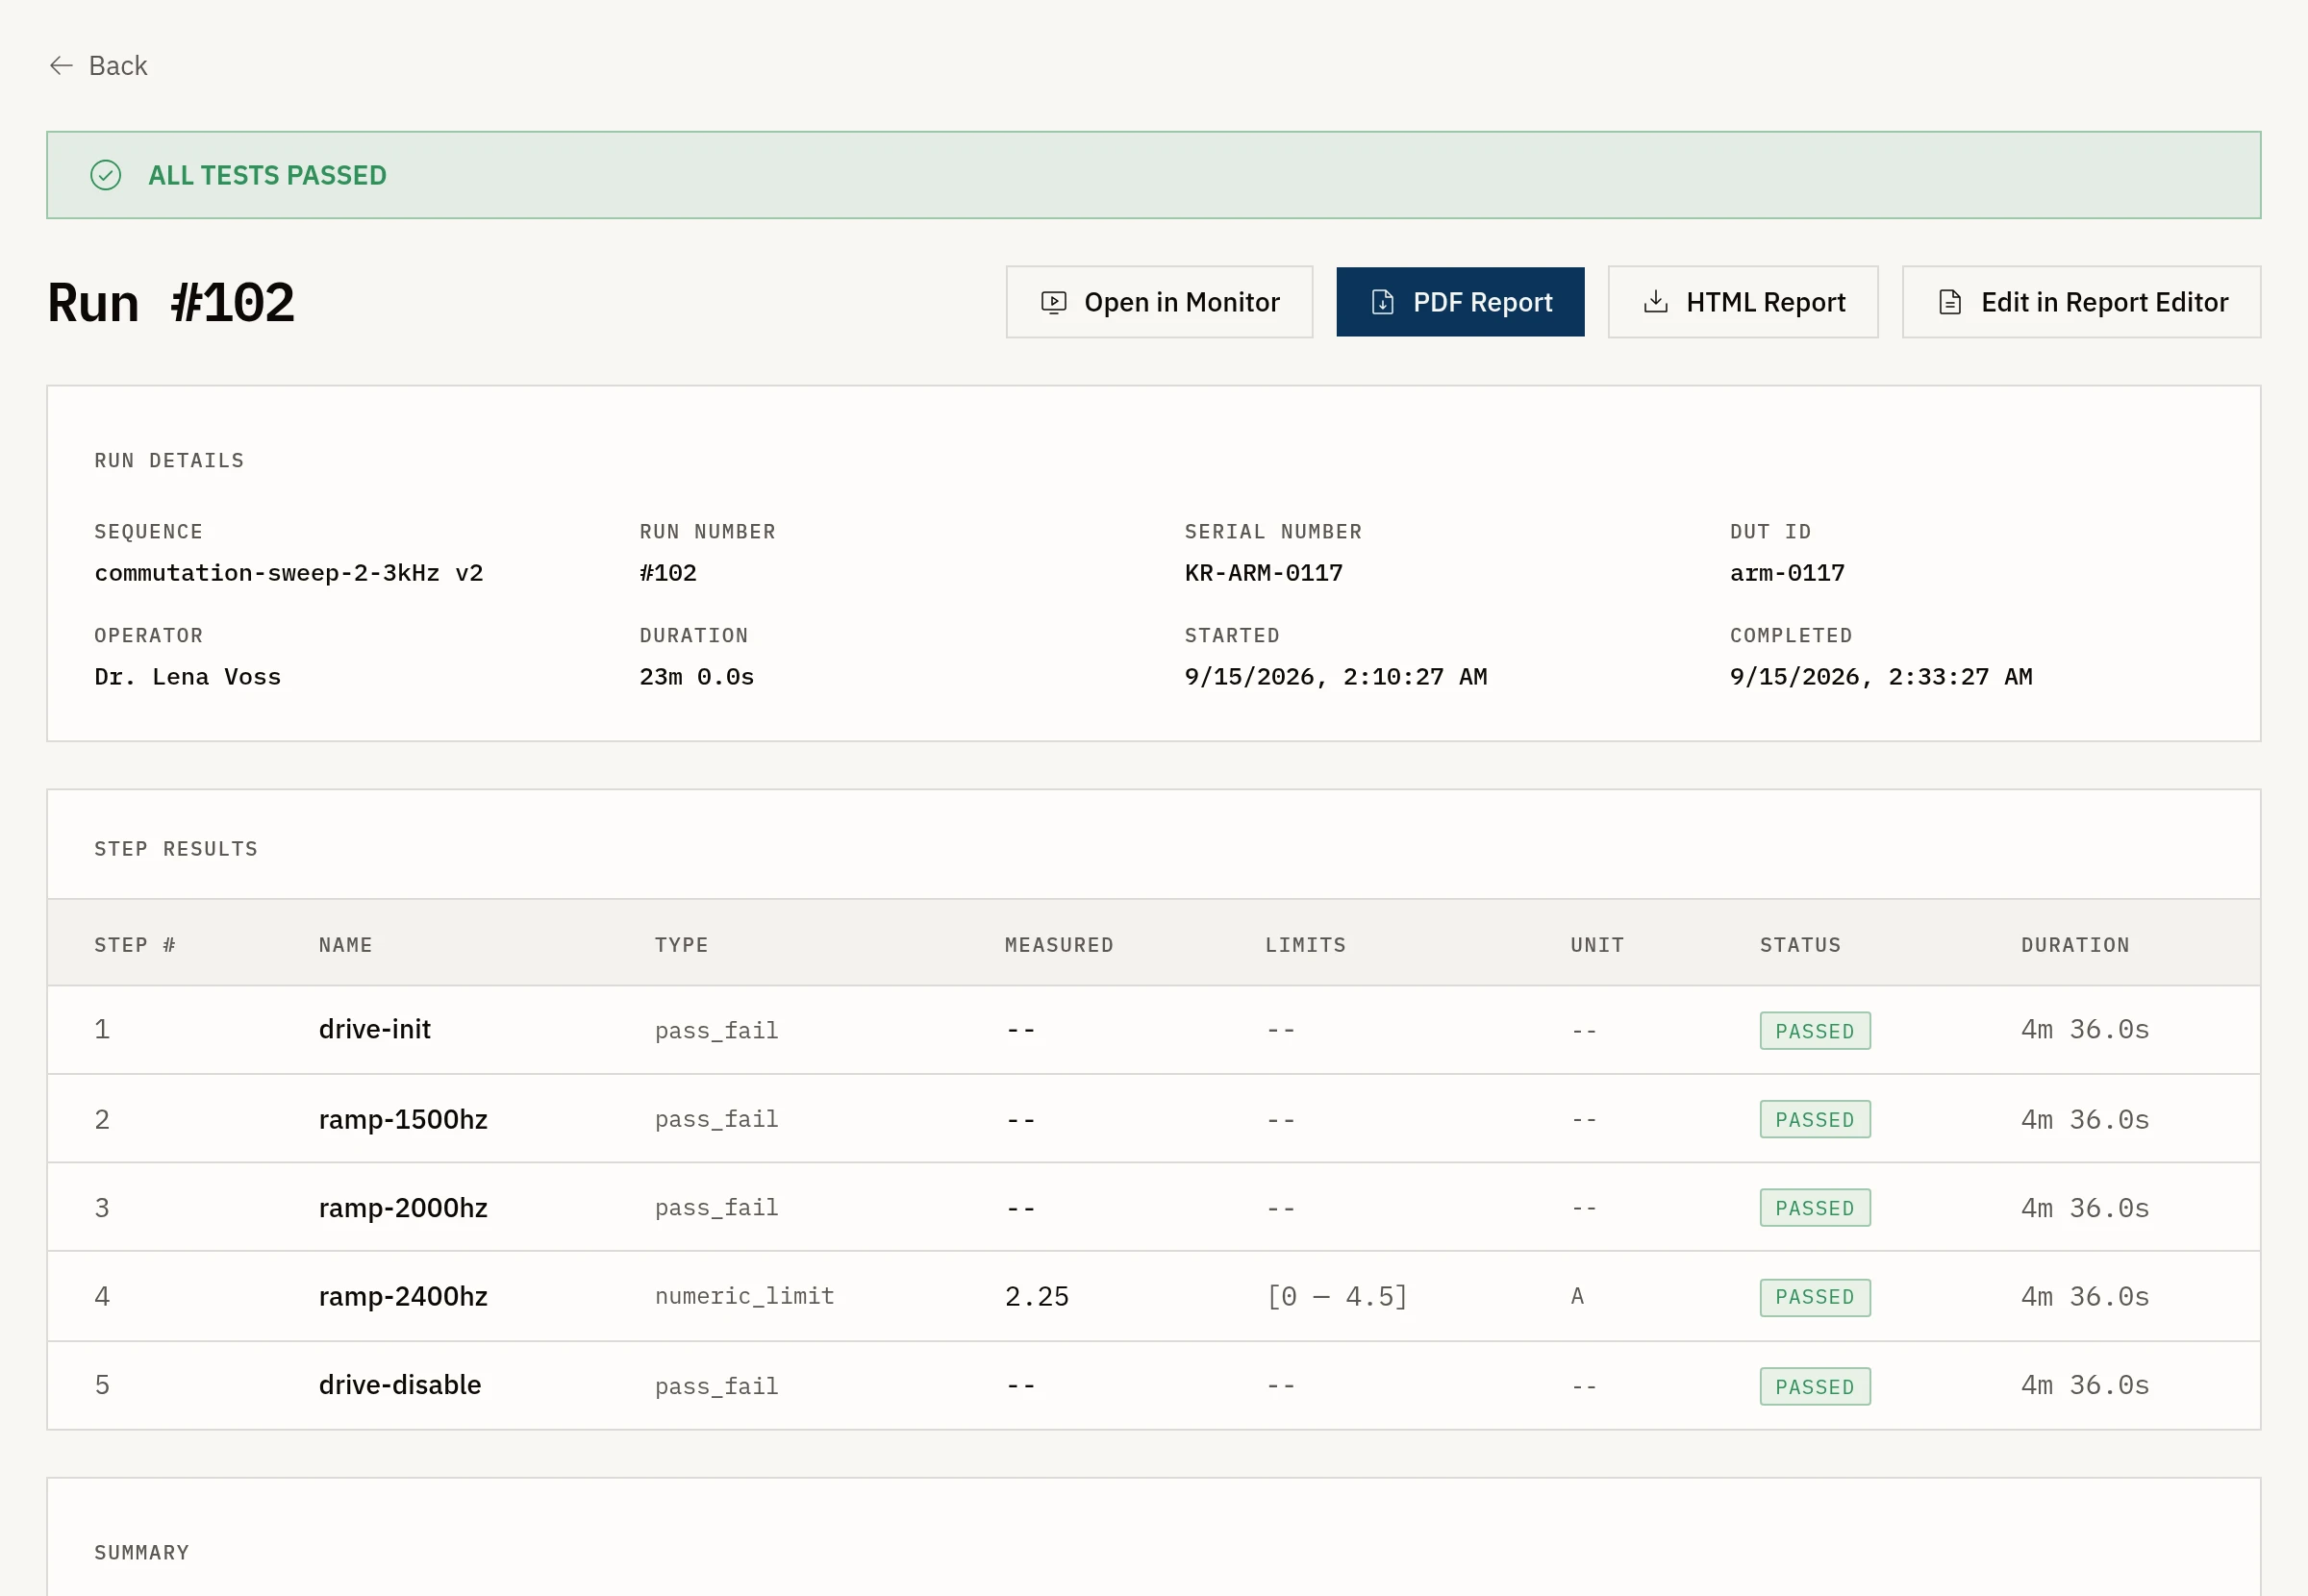
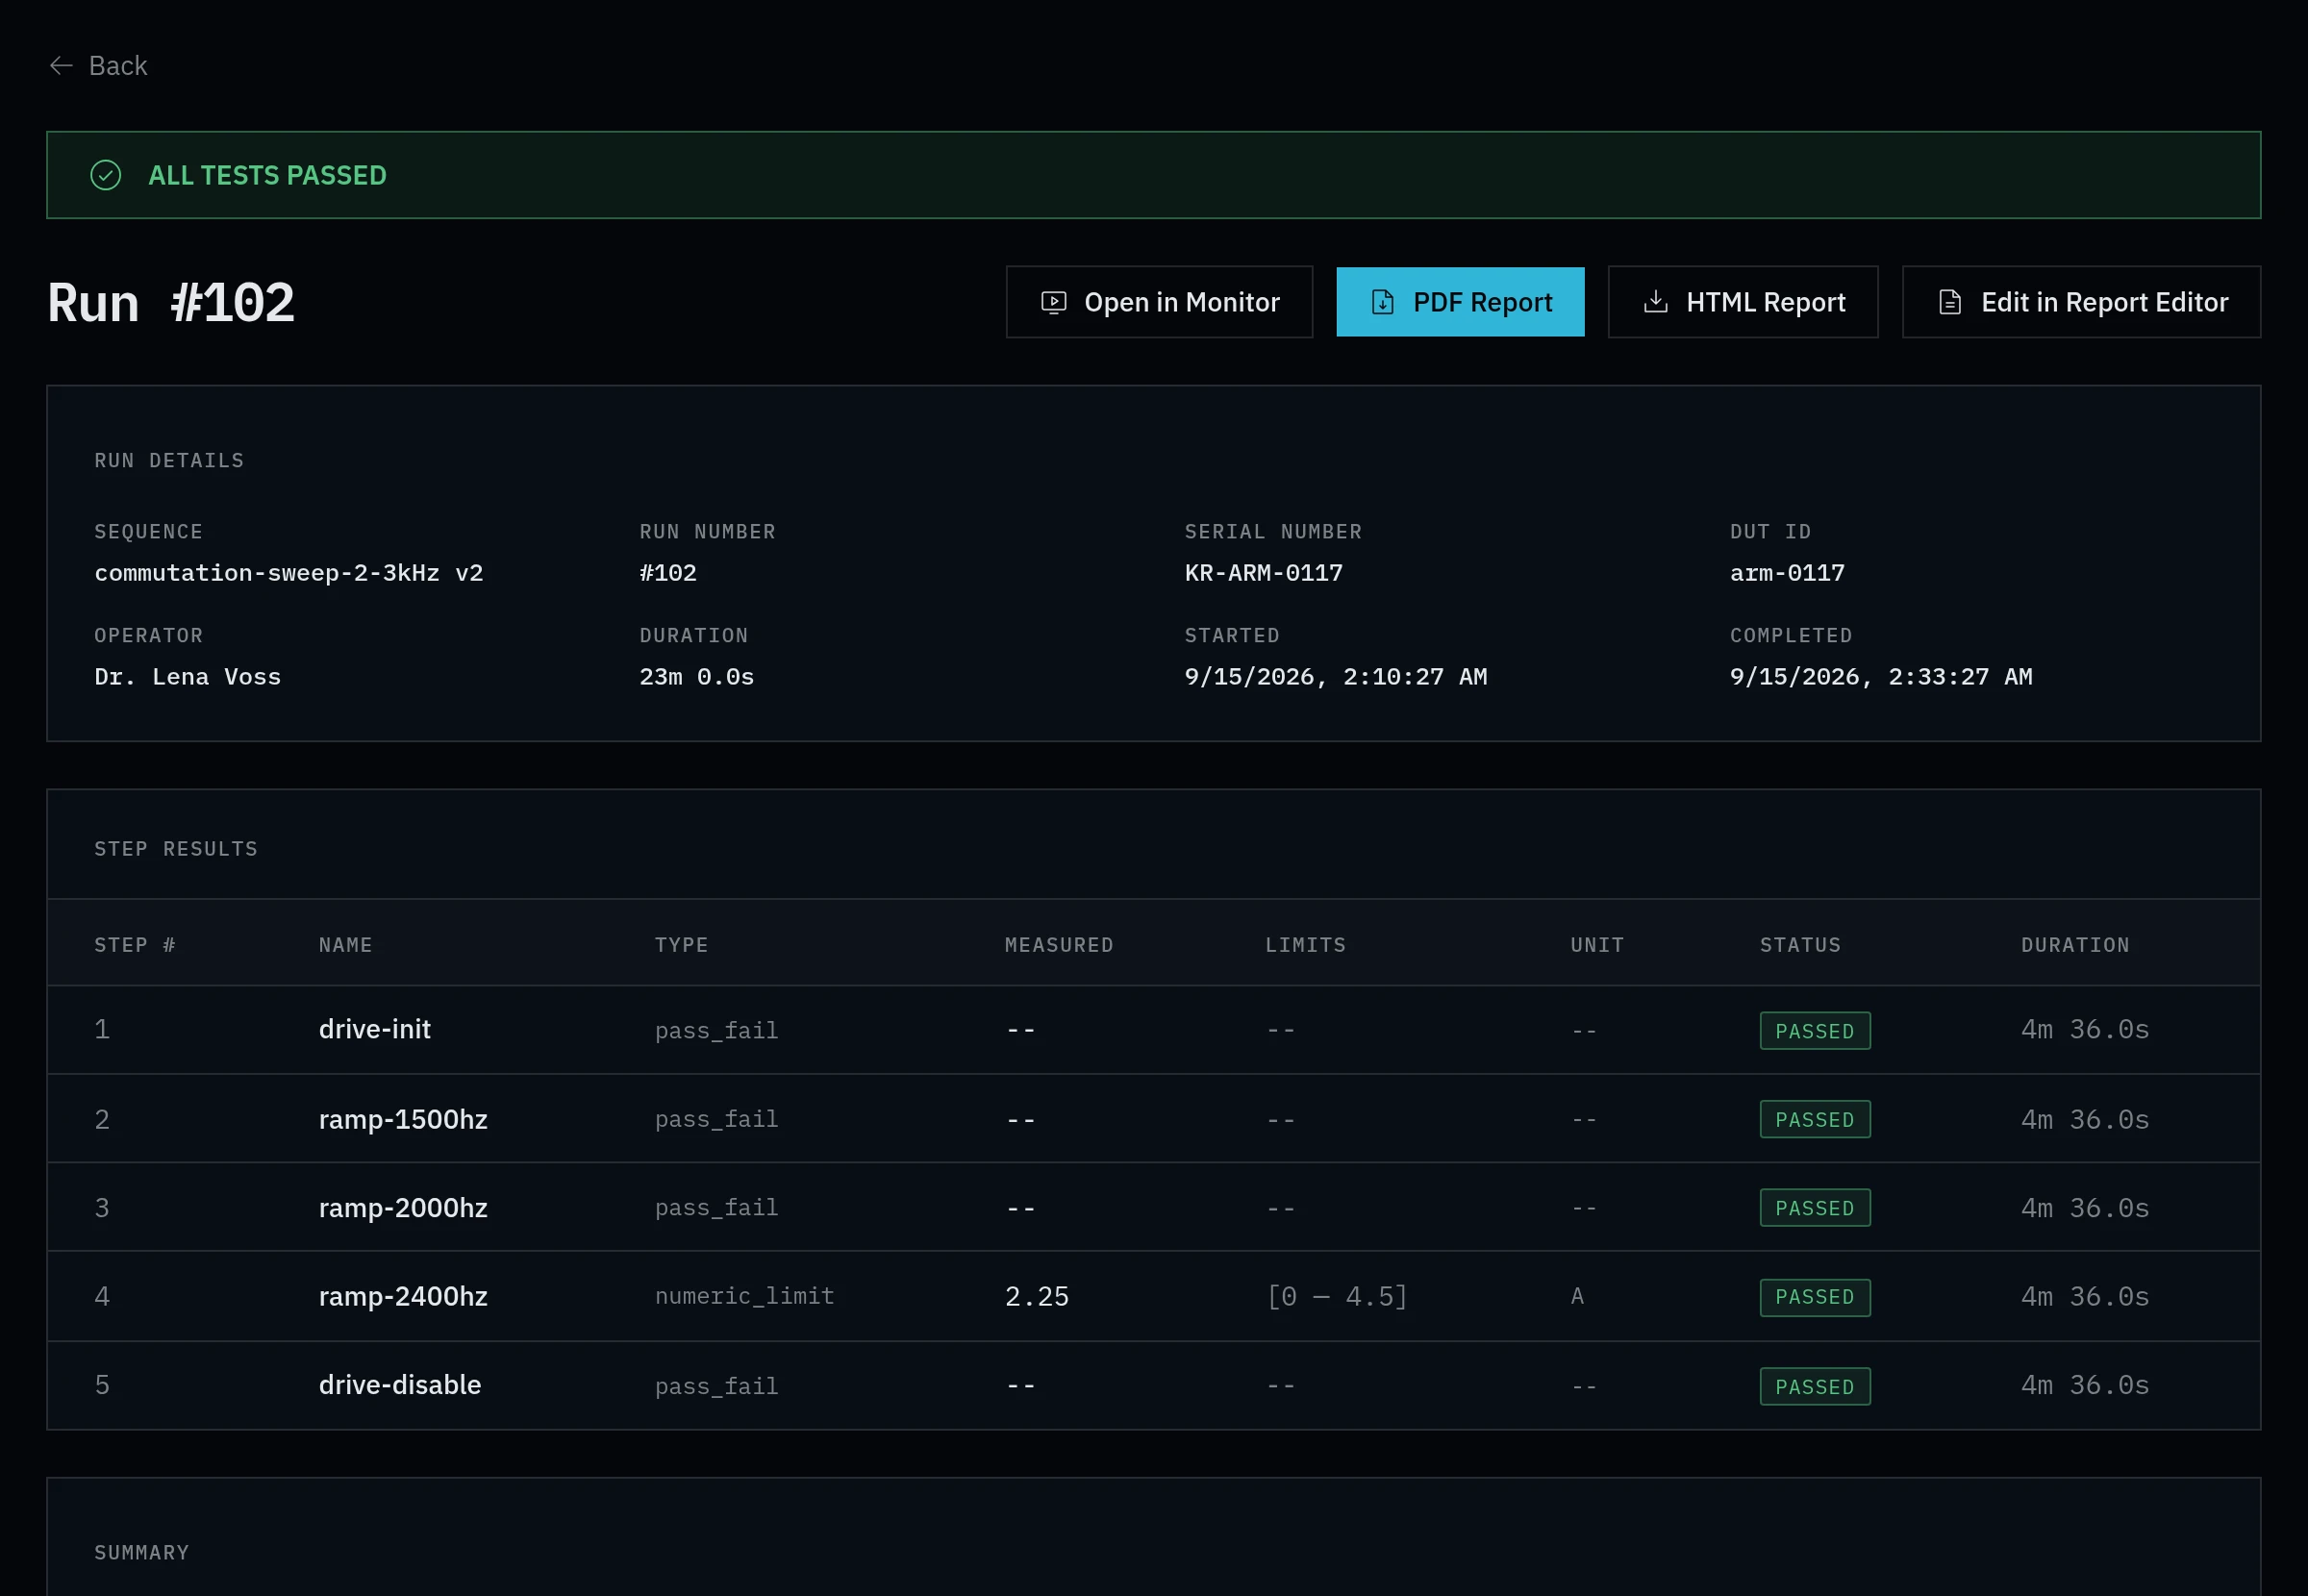
Évariste interprets that record, not its own chat history: which steps failed or passed close to a limit, whether a value drifted against earlier runs on the same unit, which instrument produced it. An engineer can ask the record a direct question (did the safety sequence run before the high-voltage step on this unit?) and get an answer citing the runs. The memory layer is described separately.
Interpretation today means analysis and explanation, not unattended, open-ended root-cause work.
Deliver: reports and evidence
The same record feeds the deliverables. A report can be drafted by Évariste from a run, generated from a data-bound LaTeX template, or written by hand in the built-in editor. Every number traces back to a command and a response, not to a pasted spreadsheet.
The record also serves as compliance evidence: who ran what, on which unit, with which instrument, against which limits. Evidence supports a certification effort; it does not grant certification or regulatory acceptance. A test lab, a certification body, or a regulator still makes that call. Packaged sign-off deliverables built from the same record, such as requirements traceability, findings, and attestation, are in build.
What agents do not do yet
The current product is the test workflow above. Several things described as AI test automation are not shipped:
- Autonomous investigations. Choosing the next experiment and resolving an open question without an engineer deciding each step. Today an engineer can ask Évariste about earlier runs, such as why a rail started failing, and get an answer that cites them; the engineer decides what to test next.
- Verified corrections. Changing the design, then measuring that the change fixed the failure.
- Complete revisions. Coordinating hardware, firmware, and test changes across a product variant.
These are the direction Galois is building toward, with autonomy expanding only inside limits engineers set. Physical changes and fabrication remain explicit dependencies; no agent re-spins a board.
Some limits will not move with better models. Agents cannot see the fixture, so setup and cabling stay human work. Calibration, measurement uncertainty, and fixture compensation remain engineering responsibilities. And we publish no speedup figure: the gain depends on how much of a cycle is authoring rather than physics, and we have found no published measurement of how much engineering time goes to test scripts.
The landscape: three ways agents reach a bench
Three examples show the range of approaches. Descriptions come from each vendor's own documentation. For how agents differ from the sequencers they drive, see test sequencers vs test agents.
| NI Nigel | Keysight MCP Server | Galois | |
|---|---|---|---|
| What it is | NI's agent, built into NI software | MCP server for Keysight instruments | Bench daemon with an MCP server, plus a cloud platform |
| Model | Azure OpenAI model, user-selectable | Your MCP client's model | Your MCP client's model, or Évariste on the LLM endpoint you choose |
| Instruments | Your project and connected hardware | Keysight instruments on its supported list | 573 profiles across vendors, plus your own |
| Generates | VIs and spec-driven TestStand sequences | SCPI command sequences | YAML sequences and instrument profiles |
| Runs tests | Starts, stops, pauses, and resumes TestStand runs | Sends approved commands over VISA | Runs approved sequences through galois-edge |
| Approval | In-product actions ask for confirmation | Engineer approves each command sequence | Sequence approval, danger flags, per-call permissions |
| Record | TestStand's result logging and reports | In-session history, cleared on restart; saved command sequences | Retained per-step trace and reports |
| Status | Shipping; NI subscription required | Beta; no-cost license; Windows only | Apache-2.0 daemon; commercial platform |
NI Nigel is NI's agent: an Azure OpenAI model over NI's documentation and your project, inside LabVIEW, TestStand, FlexLogger, InstrumentStudio, and VeriStand. It shipped as an advisor in July 2025; VI and spec-driven sequence generation arrived with the 2026 Q3 releases. On LabVIEW+ it can also connect to MCP tools. It needs an NI license with an active software service agreement, and usage is counted in requests per week across NI desktop products. For a team standardized on LabVIEW and TestStand, it is the shortest path to an agent, and results flow into TestStand's own logging and reports.
Keysight MCP Server for Instrument Control generates SCPI from each instrument's definition file and shows a plain-language preview before sending anything. It needs a third-party MCP client (Claude Code, Claude Desktop, and GitHub Copilot are named). Session state lives in memory and clears on restart, so it is an in-session log rather than a retained record. For ad hoc control of Keysight instruments from a Windows machine, it costs nothing to try. Keysight's sequencer is covered in PathWave Test Automation alternatives.
Galois trades the convenience of a feature inside a tool you already run for vendor-neutral profiles, any MCP client, and a retained per-step record. The longer comparisons are Galois vs TestStand and Galois vs LabVIEW.
Source: NI, Meet Nigel
Source: Keysight MCP Server for Instrument Control, overview
Source: Keysight MCP Server for Instrument Control, software page
Source: Keysight MCP Server for Instrument Control, release notes
Try it: an agent on your own bench
- Install galois-edge on the bench machine with the quickstart. The MCP listener is on by default at
127.0.0.1:8767/mcp, and the supervisor also exposes that port on the tailnet address and0.0.0.0(the caveat above); thecurlcheck in the client configuration guide confirms it is up. - Add the daemon to Claude Desktop, or any streamable-HTTP client, with the client configuration guide. For a bench on another machine, connect over the tailnet.
- Have the agent call
list_instrumentsandget_capabilitiesfirst. Without them it guesses at tool names. - Start read-only: identify each instrument, take one measurement. Then ask for a sequence draft and approve it only when the limits are the ones you would have written.
Inside the Galois app, the same loop runs with Évariste. Open it from the sidebar (Ctrl+Shift+E) beside a project; it reaches the bench through the same galois-edge daemon. Ask "List connected instruments" and "Measure voltage on the DMM", then give it the rail check above: 12 V in, 3.3 V rail between 3.2 V and 3.4 V. It saves the sequence as a draft. Check the commands and limits it chose, edit them in conversation or in the sequence builder, and approve; the approved sequence runs on the bench while you watch channels live in Monitor. Then ask which steps failed or passed close to a limit, and "Generate a test report from the last run". There is no MCP client to configure and no logging or report script to write. The limits, the review and approval, the wiring and confirming dangerous commands stay yours.
To script the same instruments without an agent, see SCPI instrument automation with Python. The agent layer does not replace that understanding. It lets an engineer state what a test must prove, and keeps every step of proving it on the record.
Frequently asked questions
- How is AI test automation for hardware different from software test automation?
- A bench breaks the assumptions software testing relies on. Instrument and board state persists between steps, a mistake can damage a part or an instrument, soaks and settling take as long as physics needs, and the agent cannot see probes, cabling, or which unit is in the fixture. So ask of any tool what is checked before a command reaches an instrument and what is recorded after.
- Do AI test agents replace hardware test engineers?
- No. Engineers state the objective, the hardware, and the acceptance criteria, set the limits agents run inside (instrument profiles, permissions, and approvals), and decide whether each sequence runs and whether each result stands. Setup, cabling, calibration, and measurement uncertainty stay engineering work. Agents draft sequences and instrument profiles, run approved sequences, read the per-step record, and draft reports.
- Which instruments does it work with?
- Any instrument the open-source galois-edge daemon has a profile for, over GPIB, USB, LAN, serial, CAN, or Modbus, plus devices driven through vendor SDKs. The instrument library on the instruments page covers vendors such as Keysight, Yokogawa, Tektronix, and Keithley. For an instrument without a profile, write a YAML profile, or upload its programming manual to Évariste, the agent in the Galois platform, and review the profile it drafts.
Bring Galois to your bench.
The daemon is Apache-2.0, free forever. Enterprise runs in your cloud or on-prem.