MCP for lab instruments: from first connection to a reviewed test sequence
By Alex Hernandez · · 14 min read
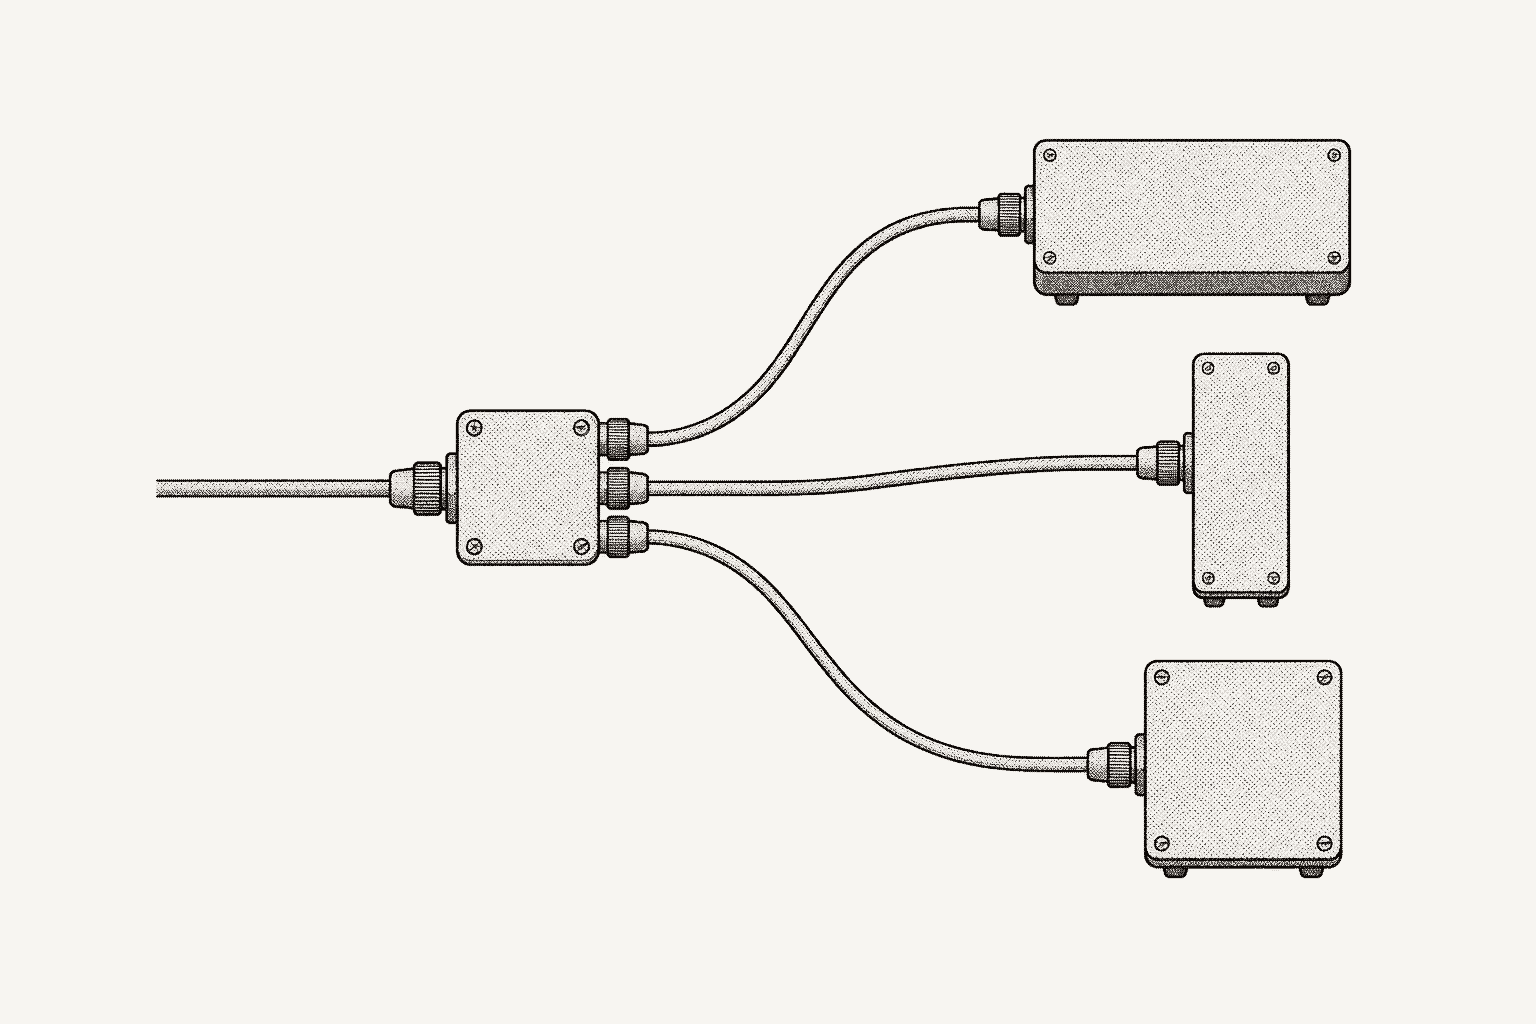
MCP, the Model Context Protocol, is an open standard that lets an AI agent discover and call tools on a server. For lab instruments, a server on the bench publishes each instrument's commands as typed tools with units and ranges. You connect a client, start with read-only calls, and let the agent draft a sequence you approve before it runs.
This guide walks that path on one bench, with tool names and behavior from the galois-edge MCP server reference.
What is the Model Context Protocol?
Anthropic released MCP in November 2024 as an open standard for connecting AI applications to data and tools; the specification and an architecture overview live at modelcontextprotocol.io. Three roles matter:
- Host: the AI application, such as Claude Code, Claude Desktop, or an agent you write.
- Client: one connection the host opens to one server. A host talking to three servers runs three clients.
- Server: the program that provides context and actions. On a bench, that is a daemon on the machine wired to the instruments.
Messages are JSON-RPC 2.0. A server can offer three primitives: tools (functions the model can invoke), resources (data for context) and prompts (reusable templates). Instrument control is about tools. Each tool has a name, a description and an inputSchema, a JSON Schema for its arguments. The client lists tools with tools/list and invokes one with tools/call, and the model chooses which tool to call from those names, descriptions and schemas. A server that declares the listChanged capability sends notifications/tools/list_changed when its tool set changes, and the client fetches the list again (tools specification).
The 2025-03-26 revision defines two standard transports. With stdio, the client launches the server as a subprocess on the same machine. With streamable HTTP, the server runs as its own process behind one HTTP endpoint that accepts POST and GET, with optional server-sent events for streaming (transport specification). An instrument server usually takes streamable HTTP, because the agent often runs on another machine.
Two lines in the tools specification shape the rest of this guide. There should always be a human in the loop with the ability to deny tool invocations. And clients must treat tool annotations, such as a hint that a tool is destructive, as untrusted unless they come from a trusted server. MCP standardizes how an agent finds and calls a tool. What the tool may do, and who must agree first, is up to the server and the client's configuration.
How does an MCP server expose test equipment?
Galois is agent-driven test engineering for hardware teams: agents generate tests and instrument drivers, run them on real benches through the open-source galois-edge daemon, and turn the results into reports and a shared engineering record.
galois-edge is the MCP server for test equipment in that system. It is Apache-2.0, runs on Linux, Windows or a Raspberry Pi, and discovers instruments over GPIB, USB, LAN, serial, Modbus and CAN. It identifies each SCPI instrument with *IDN? and matches the reply against the profiles it has loaded; Galois ships 573 instrument profiles across 135 manufacturers in its instrument library. A profile is YAML: an identity pattern, the supported interfaces, and named commands with typed parameters, units, ranges and safety flags. The MCP listener is on by default and serves streamable HTTP, transport revision 2025-03-26, on port 8767 at the path /mcp. Évariste, the agent in the Galois platform, works on the bench through the same daemon; a later section runs this guide's power check with it.
An agent connected to the daemon sees three layers of tools on one endpoint:
| Layer | Example tool names | Where it comes from |
|---|---|---|
| Static tools | list_instruments, get_capabilities, send_scpi, start_sweep | Always present, whatever is connected |
| Per-instrument tools | keithley_2400__source_voltage, keysight_34461a__measure_voltage_dc | Generated from each matched profile's commands |
| Per-SDK tools | dps150_wrapper__set_voltage | Generated from vendor-SDK wrappers that declare tool specs |
The static tools an agent reaches for most:
| Tool | What it does | Effect on instruments |
|---|---|---|
list_instruments | Lists connected instruments: ID, manufacturer, model, address, matched profile, class | None; reads cached state |
get_capabilities | Returns each instrument's commands, sequences and settings | None |
scan_instruments | Scans the buses for new instruments | Identification queries |
execute_command | Runs any named profile command on any matched instrument | Whatever the command does, query or write |
execute_sequence | Runs a multi-step measurement defined in a profile, such as an IV sweep | Runs every step |
send_scpi | Sends a raw SCPI string and skips profile validation | Whatever the string does |
start_sweep, stop_sweep | Ramps a value at a set rate on the daemon; stops or holds it | Ramps and holds outputs |
start_stream, stop_stream | Streams periodic readings as MCP progress notifications | Repeated reads |
From a profile command to a typed tool
The per-instrument tools are where MCP earns its place on a bench. The daemon names each one <profile>__<command> and builds its input schema from the profile. Take a simplified example profile for a source-measure unit, not the shipped file, in which the author capped the source at ±21 V and flagged the command that turns the output on as dangerous, leaving the off command unflagged:
commands:
  source_voltage:
    scpi: ":SOUR:VOLT {value}"
    type: write
    description: "Set the source voltage"
    params:
      value:
        type: float
        unit: V
        min: -21
        max: 21

  output_on:
    scpi: ":OUTP ON"
    type: write
    is_dangerous: true
    description: "Enable the output"

  output_off:
    scpi: ":OUTP OFF"
    type: write
    description: "Disable the output"
The first command reaches the agent as this tool:
{
  "name": "keithley_2400__source_voltage",
  "description": "Set the source voltage",
  "inputSchema": {
    "type": "object",
    "properties": {
      "value": { "type": "number", "minimum": -21, "maximum": 21, "description": "(unit: V)" }
    },
    "required": ["value"]
  },
  "annotations": { "destructiveHint": false }
}
The second becomes keithley_2400__output_on, with no parameters, the description Enable the output (destructive), and destructiveHint set to true. keithley_2400__output_off carries no flag, so turning the output off never waits on a confirmation or on danger_allow. Four consequences follow.
Ranges are checked before the wire. A call for 30 V is rejected before any SCPI reaches the instrument, and the agent gets an error it can read and correct.
Danger is visible, not enforced, at this layer. is_dangerous travels as the destructiveHint annotation, so clients that show confirmation prompts can treat the tool differently. Because the specification makes annotations advisory, read the flag as a prompt for a human. Enforcement comes from permissions and approvals, covered below.
The tool list follows the bench. Plug in a USB oscilloscope and the daemon matches it to a profile, registers its commands, and sends notifications/tools/list_changed, typically about two seconds later. Unplug it and its tools disappear.
Identical instruments stay distinct. When two connected instruments share a profile, each tool name gains the last eight characters of the instrument ID: <profile>__<short_id>__<command>.
An instrument with no matching profile still appears in list_instruments and still accepts raw SCPI through send_scpi, but it has no typed tools and no range checks. The fix is a profile: write the YAML yourself (adding a SCPI instrument profile), or upload the programming manual and review the profile Évariste drafts. Declarative instrument drivers argues why drivers written as data suit agents.
How do I connect an MCP client to my bench?
Install the daemon with the quickstart and start it. The smoke test below confirms the listener is up. The port and path are config keys (MCP_PORT, default 8767; MCP_PATH, default /mcp). On the bench machine the URL is http://127.0.0.1:8767/mcp; from another machine on the tailnet, use the bench's tailnet name, such as http://lab-pi.tail-1234.ts.net:8767/mcp.
Smoke-test the endpoint from Python
Before wiring up an agent, check the endpoint with a script. This one uses the 1.x client API of the official MCP Python SDK:
# pip install "mcp>=1.25,<2"
import asyncio

from mcp import ClientSession
from mcp.client.streamable_http import streamable_http_client

URL = "http://lab-pi.tail-1234.ts.net:8767/mcp"  # http://127.0.0.1:8767/mcp on the bench PC


async def main() -> None:
    async with streamable_http_client(URL) as (read, write, _):
        async with ClientSession(read, write) as session:
            await session.initialize()

            for tool in (await session.list_tools()).tools:
                destructive = bool(tool.annotations and tool.annotations.destructiveHint)
                print(f"{tool.name:55} {'destructive' if destructive else ''}")

            result = await session.call_tool("list_instruments", {})
            if result.isError:
                raise RuntimeError(result.content)
            for block in result.content:
                if block.type == "text":
                    print(block.text)


asyncio.run(main())
It prints every tool with its destructive flag, then the instrument list. If the connection fails, check MCP_ENABLED, the port and the network path from the client machine; the client configuration guide also shows a curl check.
Add the daemon to Claude Code
claude mcp add --transport http bench http://lab-pi.tail-1234.ts.net:8767/mcp
claude mcp list
Inside a session, /mcp shows the server's status. Claude Code names each MCP tool mcp__<server>__<tool>, so the daemon's list_instruments becomes mcp__bench__list_instruments (Claude Code MCP docs). The client configuration guide has config for Claude Desktop, Cursor, the OpenAI Agents SDK, LangGraph and LlamaIndex. Any client that speaks streamable HTTP connects the same way.
Direct path or relay path?
There are two ways to reach the daemon, and they put the security boundary in different places.
| Path | Endpoint | Per-call auth | Boundary |
|---|---|---|---|
| Direct | http://<edge>:8767/mcp | None | Network reachability: the port is exposed on the tailnet address and 0.0.0.0 |
| Relay | https://cloud.galoislabs.ai/mcp/<edge_id> | Signed token on every call | The tools the token allows, and its danger_allow flag |
On the direct path there is no per-call auth, and the daemon's supervisor exposes the MCP port on the tailnet address and on all interfaces (0.0.0.0). Treat network access to that port as access to the instruments: keep the bench machine off untrusted networks, and block the port at the host firewall on interfaces you do not trust.
The relay path carries a signed per-call token, a JWT minted for one user and one edge that expires after five minutes, and the daemon checks it against the tool permissions on every call. The token lists the allowed tools, optionally narrowed to single commands, plus a danger_allow flag; with that flag false, the daemon refuses any dangerous command whatever the list says. Failures return errors, never silent passes. Use the relay path when access should be scoped per person. The security page covers the platform's wider model.
How do I run a first read-only MCP session?
The first session should change nothing on the bench. Make that a client setting, not a sentence in the prompt. In Claude Code, put permission rules in the project's .claude/settings.json:
{
  "permissions": {
    "allow": [
      "mcp__bench__list_instruments",
      "mcp__bench__get_capabilities",
      "mcp__bench__get_status",
      "mcp__bench__list_profiles"
    ],
    "deny": [
      "mcp__bench__send_scpi",
      "mcp__bench__execute_command",
      "mcp__bench__execute_sequence",
      "mcp__bench__start_sweep"
    ]
  }
}
Claude Code evaluates deny rules before allow rules, and a tool named in a bare deny rule is removed from the model's context, so the agent never sees the raw-SCPI tool or the generic execute paths (Claude Code permissions). The four discovery tools run without asking. In Manual mode, Claude Code asks before the first use of any other tool, including each per-instrument tool.
Then give the agent a bounded task:
Call list_instruments, then get_capabilities for each instrument.
Identify each instrument and take one DC voltage reading from the
multimeter. Do not change any setting.
Expect the agent to call list_instruments, then get_capabilities, then a reading tool such as keysight_34461a__measure_voltage_dc. Approve the multimeter's reading tool. Decline tools named for a setting, such as source_voltage or output_on: calling one writes that setting. Decline tools on a supply or source-measure unit too, until you have checked what they send. Asking for the two discovery calls up front matters; without them, agents guess at tool names.
Finally, compare the agent's summary with the tool results in the transcript. The results are the evidence; the summary is a paraphrase. MCP calls go through the same command path as the daemon's gRPC API, so they land in the same audit log as gRPC calls.
How do I get an agent to draft a test sequence?
A chain of approved tool calls is a session, not a test: no limits, no pass or fail, nothing a colleague can review or rerun. Once the agent can find the right commands, the next step is a sequence: a versioned file of steps, each with an instrument, a named command and, where it measures, explicit limits.
In Galois, Évariste writes the sequence from the same profile commands and saves it as a draft. The platform refuses to run a draft until an engineer approves it, and editing an approved sequence requires a new approval. Give the agent the objective with real limits:
Draft a sequence for the board on this bench. Set the supply to 5.0 V
with a 0.5 A current limit and enable the output. Wait 500 ms. Check that
input current is 50 to 150 mA and that the 3.3 V rail reads 3.2 to 3.4 V
on the multimeter. Then disable the output. Use only commands from the
instrument profiles. Do not run it.
The draft comes back as YAML. An illustrative draft for this prompt:
name: "5 V input current and 3.3 V rail"
steps:
  - name: "Set input to 5.0 V"
    type: action
    config:
      instrument_id: "psu"
      command_name: "source_voltage"
      parameters: { value: "5.0" }

  - name: "Set current limit to 0.5 A"
    type: action
    config:
      instrument_id: "psu"
      command_name: "source_current"
      parameters: { value: "0.5" }

  - name: "Enable output"
    type: action
    config:
      instrument_id: "psu"
      command_name: "output_on"

  - name: "Settle"
    type: wait
    config: { duration_ms: 500 }

  - name: "Input current"
    type: numeric_limit
    config:
      instrument_id: "psu"
      command_name: "measure_current"
      low_limit: 0.05
      high_limit: 0.15
      comparison: "GELE"
      unit: "A"

  - name: "3.3 V rail"
    type: numeric_limit
    config:
      instrument_id: "dmm"
      command_name: "measure_voltage_dc"
      low_limit: 3.2
      high_limit: 3.4
      comparison: "GELE"
      unit: "V"

  - name: "Disable output"
    type: action
    config:
      instrument_id: "psu"
      command_name: "output_off"
Review it the way you would review a colleague's pull request:
- Named commands, not raw SCPI. Each step calls a command from the instrument's profile, so the profile owns the SCPI string and the parameter checks.
- Limits you wrote. Every
low_limitandhigh_limitshould trace to your objective. Where you gave no limit, the step should be ameasurestep, which records a value and asserts nothing, rather than a bound the agent made up. - Values safe for the board. Profile ranges protect the instrument, not your device under test. A setting can sit well inside the supply's range and still be wrong for the board.
- Settling time. 500 ms is a guess until someone checks how the board powers up.
- End state. The last step turns the output off. Also check where the bench is left if a step fails partway through.
Approve the draft when the limits are the ones you would have written. Each run then records, per step, the SCPI sent, the raw response, the measured value, the limits and the instrument, with the operator and the unit's serial number on the run. That record, not the chat, is what a later reader checks. The product overview shows the sequence and run views, and reviewing an AI-generated test plan goes deeper on the review itself.
With a third-party client connected straight to the daemon, ask for the sequence as text and review it the same way before any of it runs.
How do I run this power check in Galois with Évariste?
The same power check also runs inside the Galois app. Open Évariste from the sidebar (Ctrl+Shift+E) beside the project; it reaches the bench through the same galois-edge daemon, so the install does not change.
Discover and read. Ask "List connected instruments", then "Measure voltage on the DMM". Évariste lists the instruments on your team's edges with each profile's commands, then takes the reading. Keep this first session to reads, as on the client path. A command the profile flags as dangerous, such as output_on, waits for your confirmation. For an instrument with no profile, upload its programming manual as a PDF. Évariste generates the profile; check its ranges and safety flags against the manual before it is deployed to the edge and bound to the instrument.
Draft and edit. Give it the drafting prompt above: 5.0 V with a 0.5 A current limit, 500 ms to settle, input current 50 to 150 mA, the 3.3 V rail at 3.2 to 3.4 V on the multimeter, then output off. Évariste saves the sequence as a draft, in the YAML format shown above. Edit it in conversation or in the sequence builder; each change is a new version with a diff. If you find the board needs more than 500 ms to come up, ask for a 1 s settle:
  - name: "Settle"
    type: wait
    config: { duration_ms: 1000 }
Review and approve. Apply the same checklist: limits that trace to your objective, values safe for the board, the settling time and the end state. A machine-authored sequence stays a draft until an engineer approves it. Once the sequence is final, you can production-lock it.
Run. Wire the board, connect the multimeter across the 3.3 V rail, and start the run. It executes on the bench through galois-edge while you watch the channels live in Monitor.
Results and interpretation. The run records each step's measured value, limits, pass or fail, raw command and response, and instrument, with the operator, the board's serial number and timestamps. Ask which steps failed or passed close to a limit: an input current just under 150 mA passes but deserves a look. Évariste also compares runs across boards and answers questions over project memory, citing the runs and notes.
Report. "Generate a test report from the last run" produces a PDF or HTML report from a LaTeX template. You can edit it in the report editor and share it, for example to Slack.
| Step | Your MCP client (above) | Galois with Évariste |
|---|---|---|
| Connect | galois-edge, smoke_test.py, client config | galois-edge; Évariste beside the project |
| Discover | list_instruments, get_capabilities | "List connected instruments" |
| Read-only check | Deny rules; approve the DMM reading | "Measure voltage on the DMM"; confirm dangerous commands |
| Missing profile | Write the YAML, or review a draft | Upload the manual; review, deploy, bind |
| Draft and edit | Drafting prompt; edit the YAML | Same prompt; versioned edits with diffs |
| Approve | Your review before anything runs | Draft approval; optional production lock |
| Run | Client tool calls under permission rules | Run through galois-edge; watch in Monitor |
| Results | Transcript and daemon audit log | Per-step value, limits, pass or fail, raw command and response |
| Interpret | Check the summary against the results | Failures, near-limit passes, run comparisons |
| Report | Your own script or document | Generated PDF or HTML report |
With Évariste, you no longer write or maintain the smoke-test script, the client configuration and its permission file, logging for each step's result, or a report script. Stating the objective and limits from the board's datasheet, reviewing the draft, approving it, wiring the board and keeping the bench safe stay your job.
Common problems with MCP and lab instruments
| Symptom | Likely cause | Fix |
|---|---|---|
| The client cannot connect | Listener disabled, wrong port, or no network path | Check MCP_ENABLED and MCP_PORT; from the client machine, run the smoke test above or the curl check in the client configuration guide |
| An instrument is listed but has no typed tools | No profile matched its *IDN? reply | Add a profile; until then send_scpi reaches it, without validation |
| The agent calls tools that do not exist | It skipped discovery | Have it call list_instruments and get_capabilities first |
| A call fails with a range error | The argument is outside the profile's min or max | Correct the value, or the profile if its range is wrong |
| Tool names gained a suffix | A second instrument with the same profile connected | Use the suffixed names; each maps to one instrument |
| A ramp command is refused | The profile marks it requires_sweep | Use start_sweep with a rate, and stop_sweep to hold or abort |
Where to go from here
MCP gives an agent a standard way to find and call instrument commands. The limits come from elsewhere: profile ranges, client permissions, the relay token and the approval gate. Set those before an agent touches an output.
For the full loop of generating, running and interpreting tests with agents, read AI test automation for hardware benches. For what can go wrong when a model drives hardware, read LLM instrument safety. To script the same instruments without an agent, start with SCPI instrument automation with Python. The platform runs as Galois Cloud, a dedicated single-tenant cloud, or fully on-prem and air-gapped, with Évariste routed to the LLM endpoint you choose (deployment options).
Frequently asked questions
- What is MCP for test equipment?
- MCP, the Model Context Protocol, is an open standard for connecting AI applications to tools. An MCP server for test equipment runs next to the instruments and publishes their commands as tools with typed inputs, so an agent can discover an instrument and call it without reading its manual. The galois-edge daemon names these tools profile__command, such as keithley_2400__source_voltage.
- Is it safe to let an AI agent control lab instruments over MCP?
- Only inside limits the agent cannot change. In galois-edge, typed tools reject values outside the profile's ranges before any SCPI is sent, and dangerous commands carry the MCP destructiveHint annotation. Your client's permission rules decide which tools the agent can see and call, and a Galois sequence cannot run until an engineer approves it. On the direct path, network access to the MCP port is the boundary, so keep that port off untrusted networks.
- Which MCP clients work with galois-edge?
- Any client that supports MCP's streamable HTTP transport. Claude Code connects with claude mcp add --transport http, and the galois-edge client configuration guide covers Claude Desktop, Cursor, the OpenAI Agents SDK, LangGraph, LlamaIndex and the MCP Python SDK.
- What if my instrument has no profile?
- It still appears in list_instruments and accepts raw SCPI through the send_scpi tool, which skips profile validation. To get typed tools with ranges and units, add a YAML profile, or upload the programming manual and review the profile Évariste drafts before it drives hardware.
- What is the difference between the direct and relay paths?
- The direct path dials the daemon on port 8767 over the tailnet or loopback. There is no per-call auth, and the port is exposed on the tailnet address and 0.0.0.0. The relay path goes through cloud.galoislabs.ai, and every call carries a signed per-call token that the daemon checks against tool permissions.
Bring Galois to your bench.
The daemon is Apache-2.0, free forever. Enterprise runs in your cloud or on-prem.